Potential (kV)
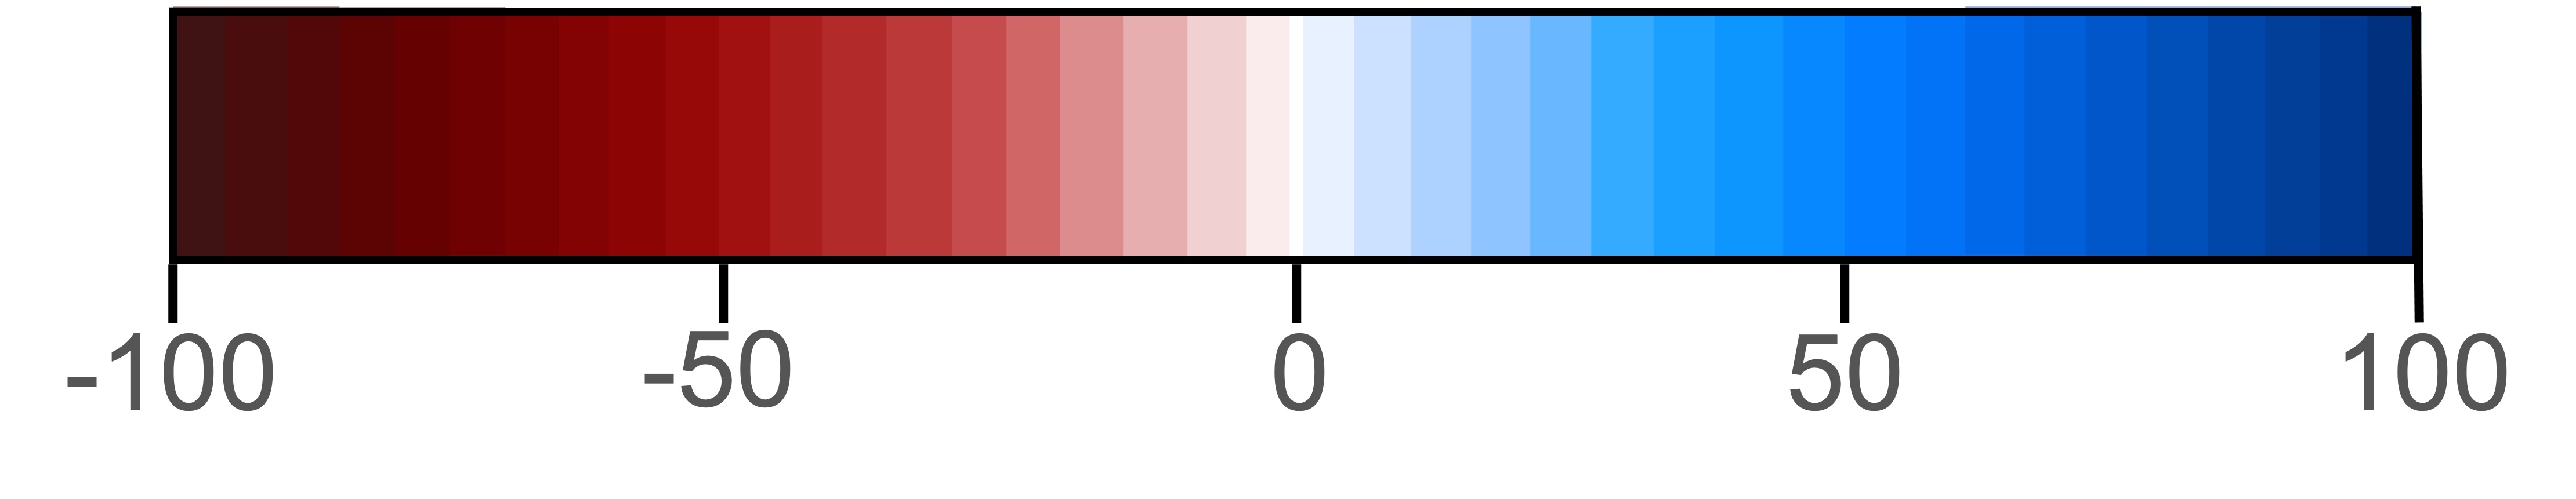
Minimum potential
Maximum potential
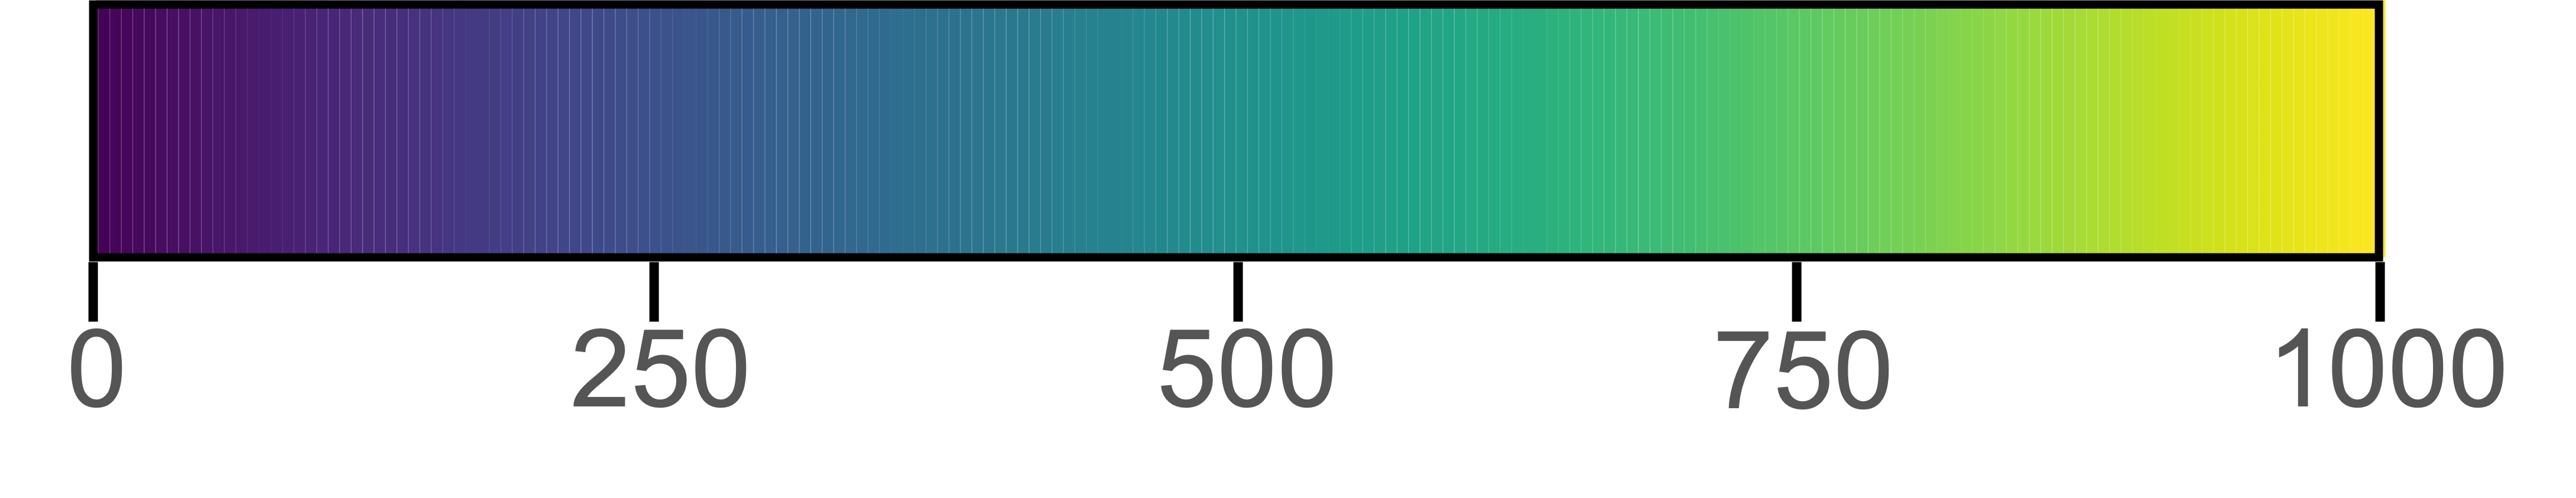
Magnitude of Fitted Velocity (m/s)
+ auroral oval is estimated by the OVATION model hosted by NOAA where opacity correlates to the probability of viewing the aurora.
More Info
Real-time convection maps are produced from any available northern hemisphere real-time SuperDARN data.
Thin grey dashed lines denote magnetic latitude at 10 degree intervals.
Thick black dashed line denotes the Heppner-Maynard Boundary.
Pale grey shading denotes where at 250km in the ionosphere is in darkness.
SuperDARN Canada's radars use Borealis with package backscatter to produce FITACF data. This FITACF data is converted into map files using RST version 4.6. pyDARN functions are used to plot the position of the convection cells and fitted velocities before being sent to the browser to be plotted in D3.js.
The convections maps are produced every minute and are averaged over the two previous minutes of data. In optimum conditions this tool should operate on no more than a 2-2.5 minute delay, so that the code has time to collect the data.
RST produced real-time convection maps are also available here.
Map Info
Time (UT): |
|
Radars Included: |
|
Model Name: |
|
Polar Cap Potential: |
|
Fit Order: |
|
Num Data Points: |
IMF
Bx: nT
By: nT
Bz: nT
|B|: nT
Delay: 10 mins
ρ: cm-3
V: kms-1
T: °K